EKG | Paramedic | MA
Understanding the EKG Strip
Understanding the EKG Strip
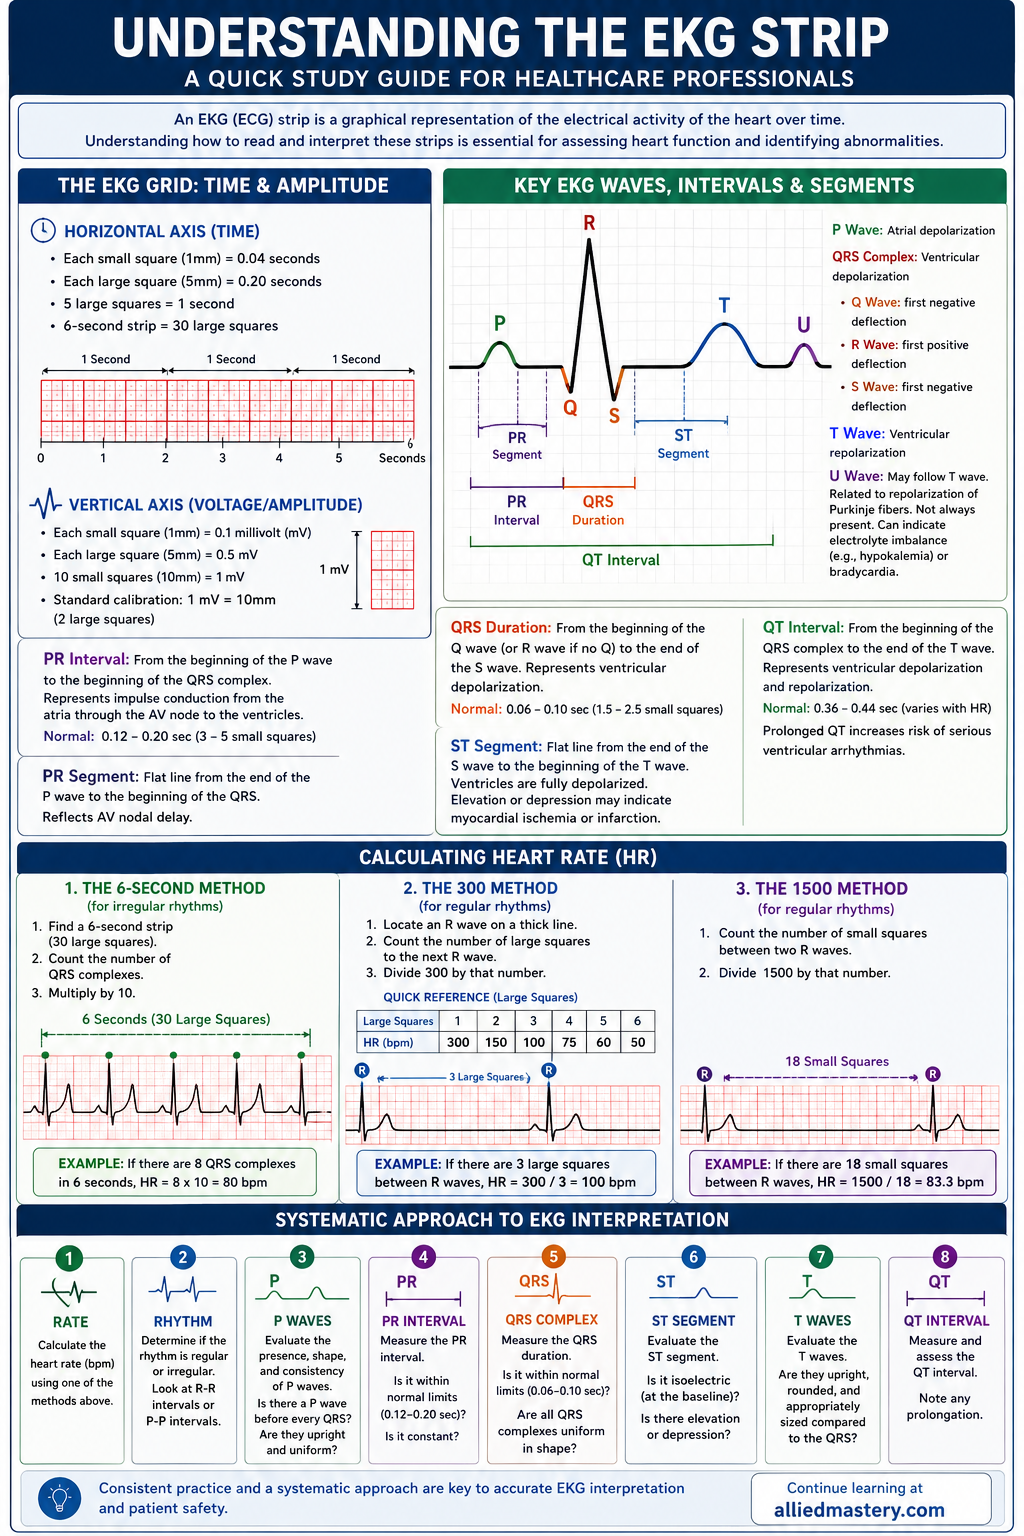
An electrocardiogram (EKG or ECG) strip is a graphical representation of the electrical activity of the heart over time. Understanding how to read and interpret these strips is fundamental for healthcare professionals to assess heart function and identify potential abnormalities.
The EKG Grid: Time and Amplitude
EKG paper is a standardized grid designed to measure both time and electrical voltage (amplitude).
Horizontal Axis (Time)
- Each small square (1mm x 1mm) represents 0.04 seconds.
- Each large square (5mm x 5mm, composed of 5 small squares horizontally and 5 small squares vertically) represents 0.20 seconds (5 x 0.04 s).
- There are 5 large squares in 1 second (5 x 0.20 s = 1.0 s).
- A 6-second strip (commonly used for heart rate calculation) contains 30 large squares (6 s / 0.20 s per large square).
Vertical Axis (Voltage/Amplitude)
- Each small square (1mm) represents 0.1 millivolt (mV).
- Each large square (5mm) represents 0.5 mV.
- Standard EKG machine calibration usually sets the vertical axis so that 10 small squares (10mm) equal 1 mV. This means a 1 mV signal will cause the stylus to deflect 10mm (two large squares) vertically.
Key EKG Waves, Intervals, and Segments
Each beat on an EKG strip consists of distinct deflections (waves) and flat lines (segments), which combine to form intervals. These reflect specific electrical events in the heart.
Waves
- P Wave: Represents atrial depolarization (contraction of the atria). It is typically a small, rounded, upright wave.
- QRS Complex: Represents ventricular depolarization (contraction of the ventricles). It is usually the tallest and sharpest deflection.
- Q Wave: The first negative (downward) deflection after the P wave.
- R Wave: The first positive (upward) deflection after the P wave.
- S Wave: The first negative (downward) deflection after the R wave.
- T Wave: Represents ventricular repolarization (relaxation of the ventricles). It is typically a rounded, asymmetrical, upright wave.
- U Wave: A small, often inconspicuous wave that sometimes follows the T wave, thought to be related to repolarization of the Purkinje fibers. Not always present and often benign, but can indicate electrolyte imbalance (e.g., hypokalemia) or bradycardia.
Intervals
- PR Interval: Measures the time from the beginning of the P wave to the beginning of the QRS complex. It represents the time it takes for the electrical impulse to travel from the atria through the AV node to the ventricles.
- Normal Duration: 0.12 to 0.20 seconds (3 to 5 small squares).
- QRS Duration: Measures the time from the beginning of the Q wave (or R wave if no Q) to the end of the S wave. It represents the time for ventricular depolarization.
- Normal Duration: 0.06 to 0.10 seconds (1.5 to 2.5 small squares).
- QT Interval: Measures the time from the beginning of the QRS complex to the end of the T wave. It represents the total time for ventricular depolarization and repolarization.
- Normal Duration: Varies with heart rate, typically 0.36 to 0.44 seconds. A prolonged QT interval can increase the risk of serious ventricular arrhythmias.
Segments
- PR Segment: The flat line from the end of the P wave to the beginning of the QRS complex. It reflects the delay of the impulse at the AV node.
- ST Segment: The flat line from the end of the S wave to the beginning of the T wave. It represents the period when the ventricles are completely depolarized before repolarization begins.
- Elevation or Depression of the ST segment is a critical indicator of myocardial ischemia or infarction.
Calculating Heart Rate (HR)
Accurate heart rate determination is crucial for EKG interpretation. Here are common methods:
1. The 6-Second Method (for irregular rhythms)
- Find a 6-second strip (30 large squares).
- Count the number of QRS complexes within that 6-second strip.
- Multiply that number by 10.
- Example: If there are 8 QRS complexes in 6 seconds, the HR is 8 x 10 = 80 bpm.
2. The 300 Method (for regular rhythms)
- Locate an R-wave that falls on a thick line (a large square boundary).
- Count the number of large squares to the next R-wave.
- Divide 300 by the number of large squares.
- Example: If there are 3 large squares between R-waves, HR = 300 / 3 = 100 bpm.
- Quick Reference: If the next R-wave falls on the next consecutive thick line, the rates are:
- 1 large square: 300 bpm
- 2 large squares: 150 bpm
- 3 large squares: 100 bpm
- 4 large squares: 75 bpm
- 5 large squares: 60 bpm
- 6 large squares: 50 bpm
3. The 1500 Method (for regular rhythms, more precise)
- Count the number of small squares between two consecutive R-waves.
- Divide 1500 by this number.
- Example: If there are 18 small squares between R-waves, HR = 1500 / 18 = 83.3 bpm.
Systematic Approach to EKG Strip Interpretation
When evaluating an EKG strip, follow a consistent, systematic approach:
- Rate: Calculate the heart rate (bpm).
- Rhythm: Determine if the rhythm is regular or irregular. Look at the R-R intervals (distance between consecutive R waves) or P-P intervals (distance between consecutive P waves).
- P Waves: Evaluate the presence, shape, and consistency of P waves. Is there a P wave before every QRS? Are they upright and uniform?
- PR Interval: Measure the PR interval. Is it within normal limits (0.12-0.20 seconds)? Is it constant?
- QRS Complex: Measure the QRS duration. Is it within normal limits (0.06-0.10 seconds)? Are all QRS complexes uniform in shape?
- ST Segment: Evaluate the ST segment. Is it isoelectric (at the baseline)? Is there elevation or depression?
- T Waves: Evaluate the T waves. Are they upright, rounded, and appropriately sized compared to the QRS?
- QT Interval: Measure and assess the QT interval, especially noting any prolongation.
By systematically analyzing each component of the EKG strip, healthcare professionals can identify normal heart function or detect specific arrhythmias and cardiac conditions.
Ready to Go Deeper?
This is just a sample of what Allied Mastery offers. Sign up to unlock our full library, create custom quizzes, track your performance, and more.